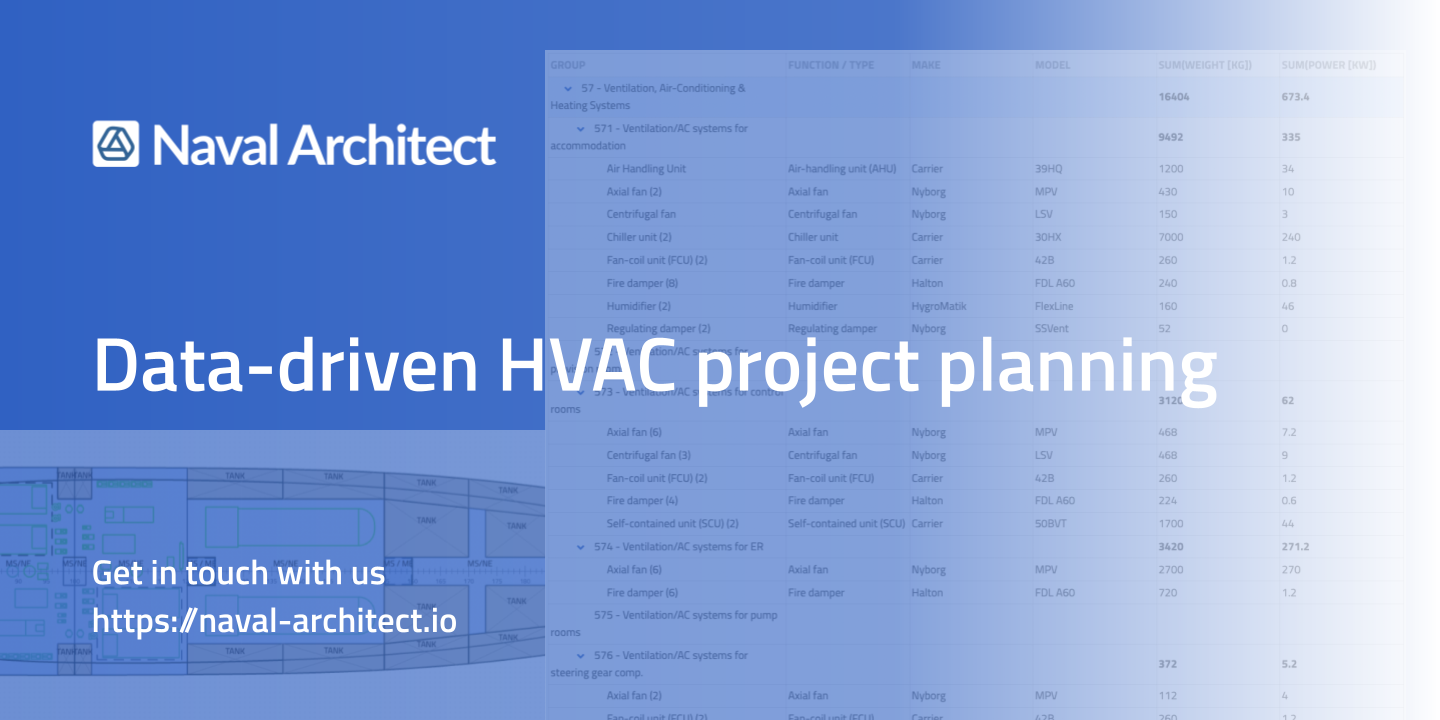
Heating, Ventilation, and Air Conditioning (HVAC) are one of the most complex and widespread, yet…
Naval Architect’s new reporting feature for efficient project data management
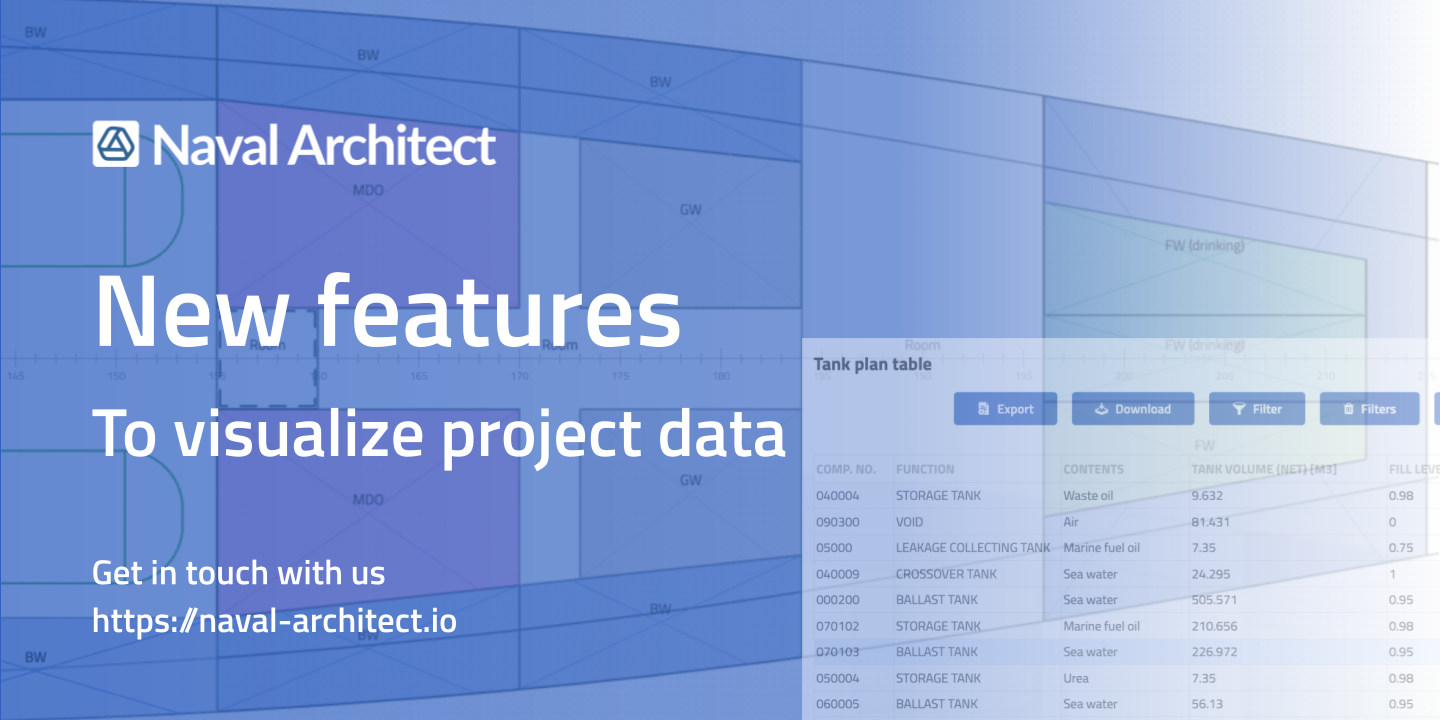
Naval Architect is a web-based cloud platform designed for the shipbuilding industry to collaborate via a shared digital ship model. The model serves as an easy-to-use, customizable database for efficient project data management. The new reporting feature enables the creation of reliable project costings and estimates from the earliest stages of ship design.
Why bother?
Knowing the future cost of your project is a key to survival in the competitive shipbuilding industry. Calculating cost and weight requires geometric data such as areas, volumes, or COG, which at a very early stage cannot be obtained from the 2D General Arrangement Plan (GAP). In the traditional approach, project teams measure the above parameters by hand in 2D and calculate material, weight and cost on this basis. However, all this is usually done in separate drawings and excel spreadsheets. The results of such analysis are inconsistent, inaccessible and difficult to revise. This is definitely not efficient project data management.
Data to rule them all
The model in Naval Architect is a database. In addition to the beautifully rendered geometry, it generates a number of geometric parameters required for engineering estimates. Moreover, your team can customize the model to their specific needs by defining objects types and their properties. We call it the 5D model and cover the technical details in this article.
With the report function you can now access the data in the 5D model even more flexibly!
The repoting function
Reports created in Naval Architect contain values associated with geometry properties. They can list any type of geometry that the user has created, such as bulkheads, tanks, components, etc. The reports provide any kind of data manipulation like a typical database, but with an easy to understand user interface and a direct reference to the 3D geometry.
Data in individual columns can be grouped by any properties. Columns can be added and deleted according to project or calculation needs. Variety of custom filters can be applied to display and modify only the records we actually need. Moreover, in Naval Architect, all data automatically updates on change in the model and all information becomes instantly accessible to anyone working on the project.
efficient project data management on the example of insulation calculation
Let us show an example: a rather common problem in the calculation of insulation. It affects both weight and cost and is extremely difficult to assess by manual calculation in 2D.
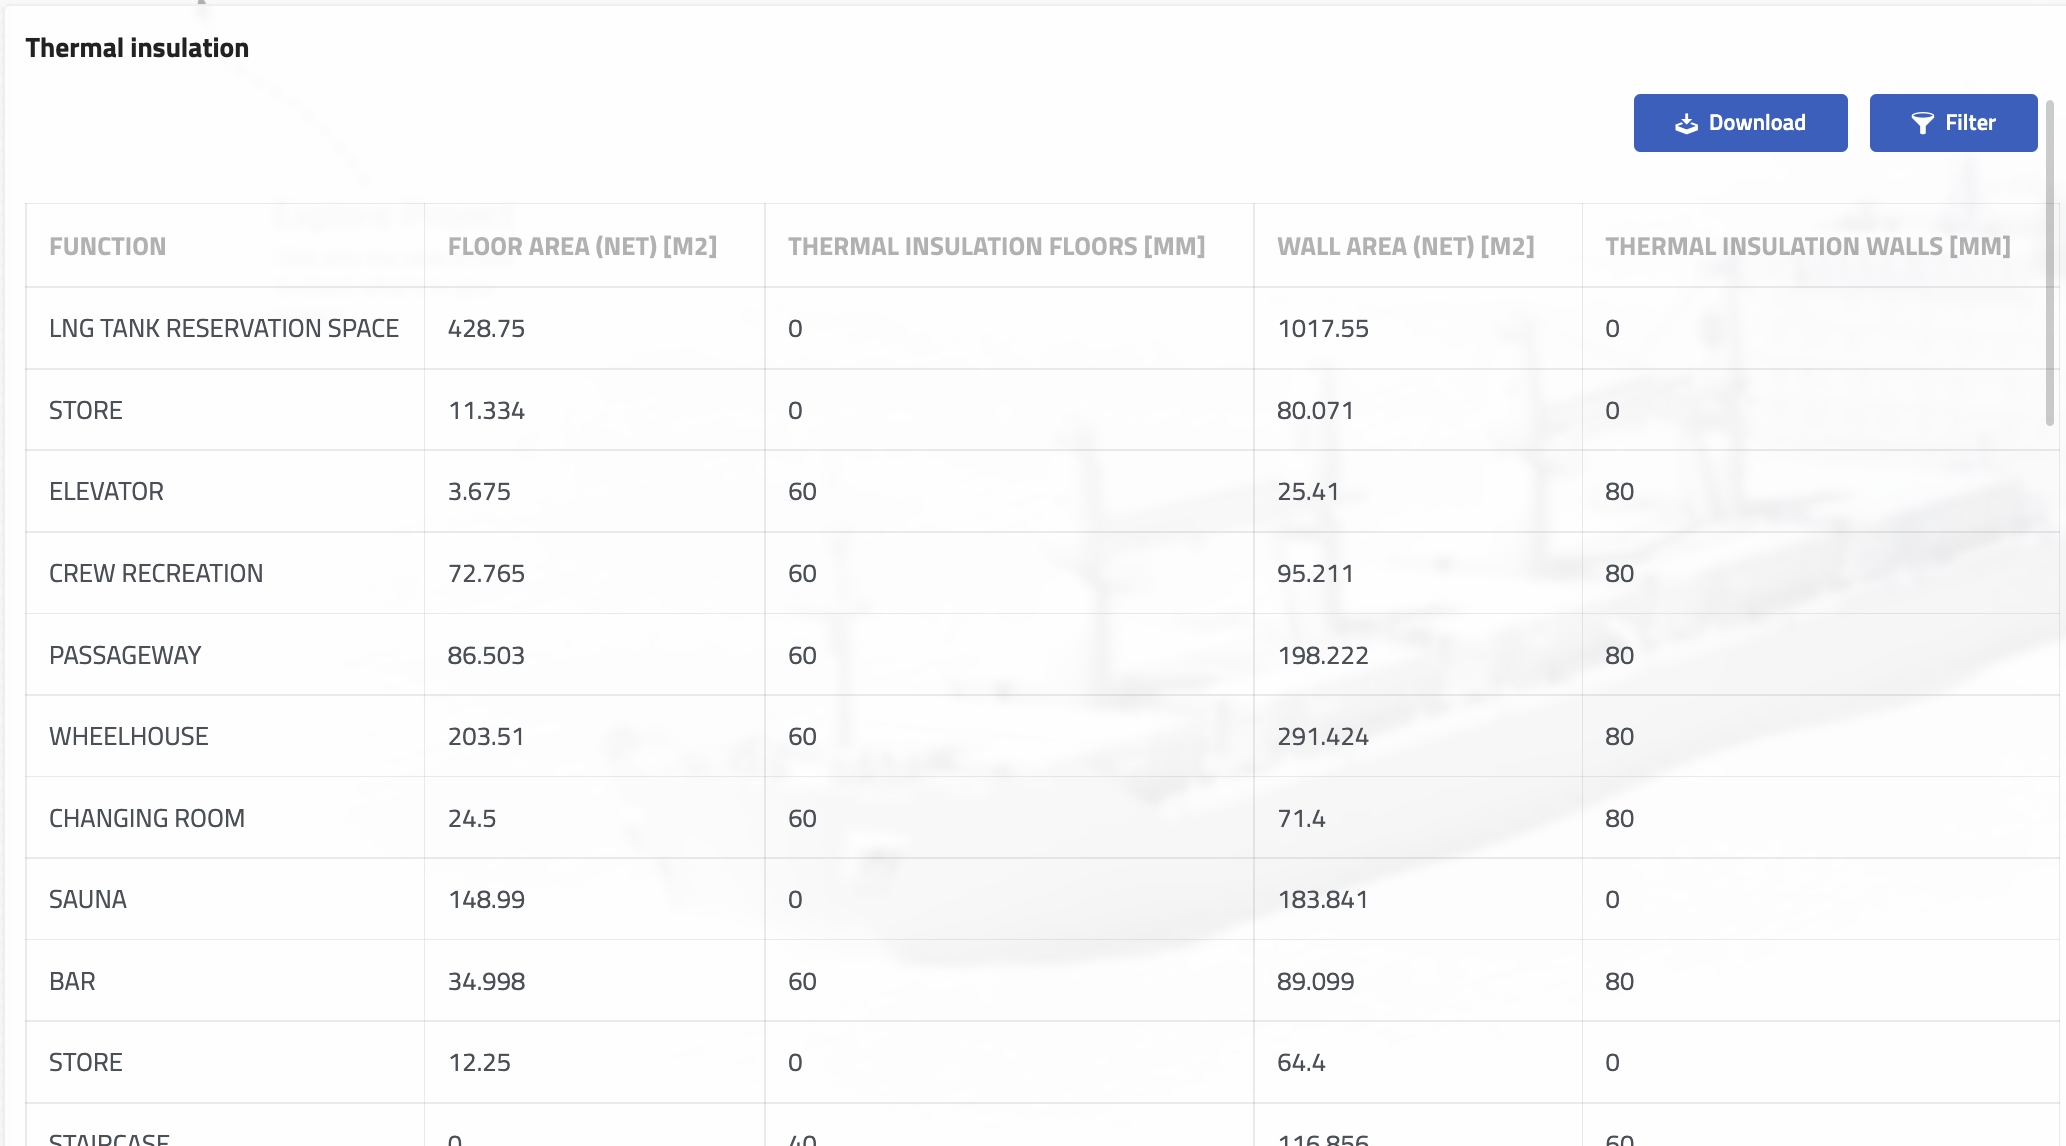
Properties for the calculation of thermal insulation
Each of the Rooms defined in the model is given the following user-defined ‘thermal insulation’ properties:
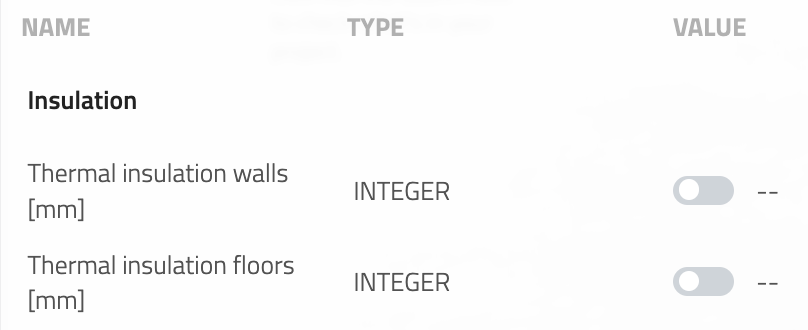
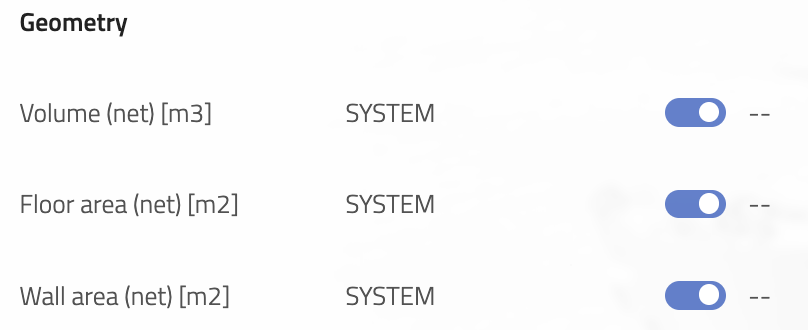
and a set of geometric properties that are automatically filled in by the system:
For simplicity, the area of the walls is summed in this example. Normally we would differentiate the individual walls, since some of them face the outside of the ship and may be insulated differently than those that face the interior.
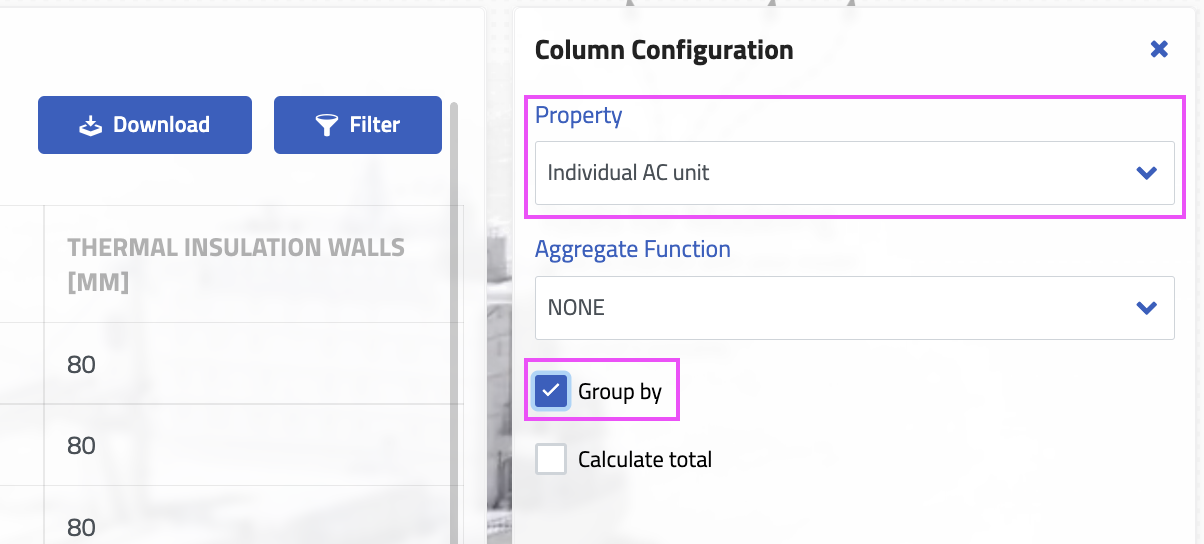
Filling in the values in the report – ‘Group by’ function
In a typical ship, the thermal insulation of the air-conditioned spaces (AC) in the accommodation area is different from that in the machinery spaces. The thickness of insulation applied in certain types of spaces could also be defined in the BS or be part of the shipyard standard.
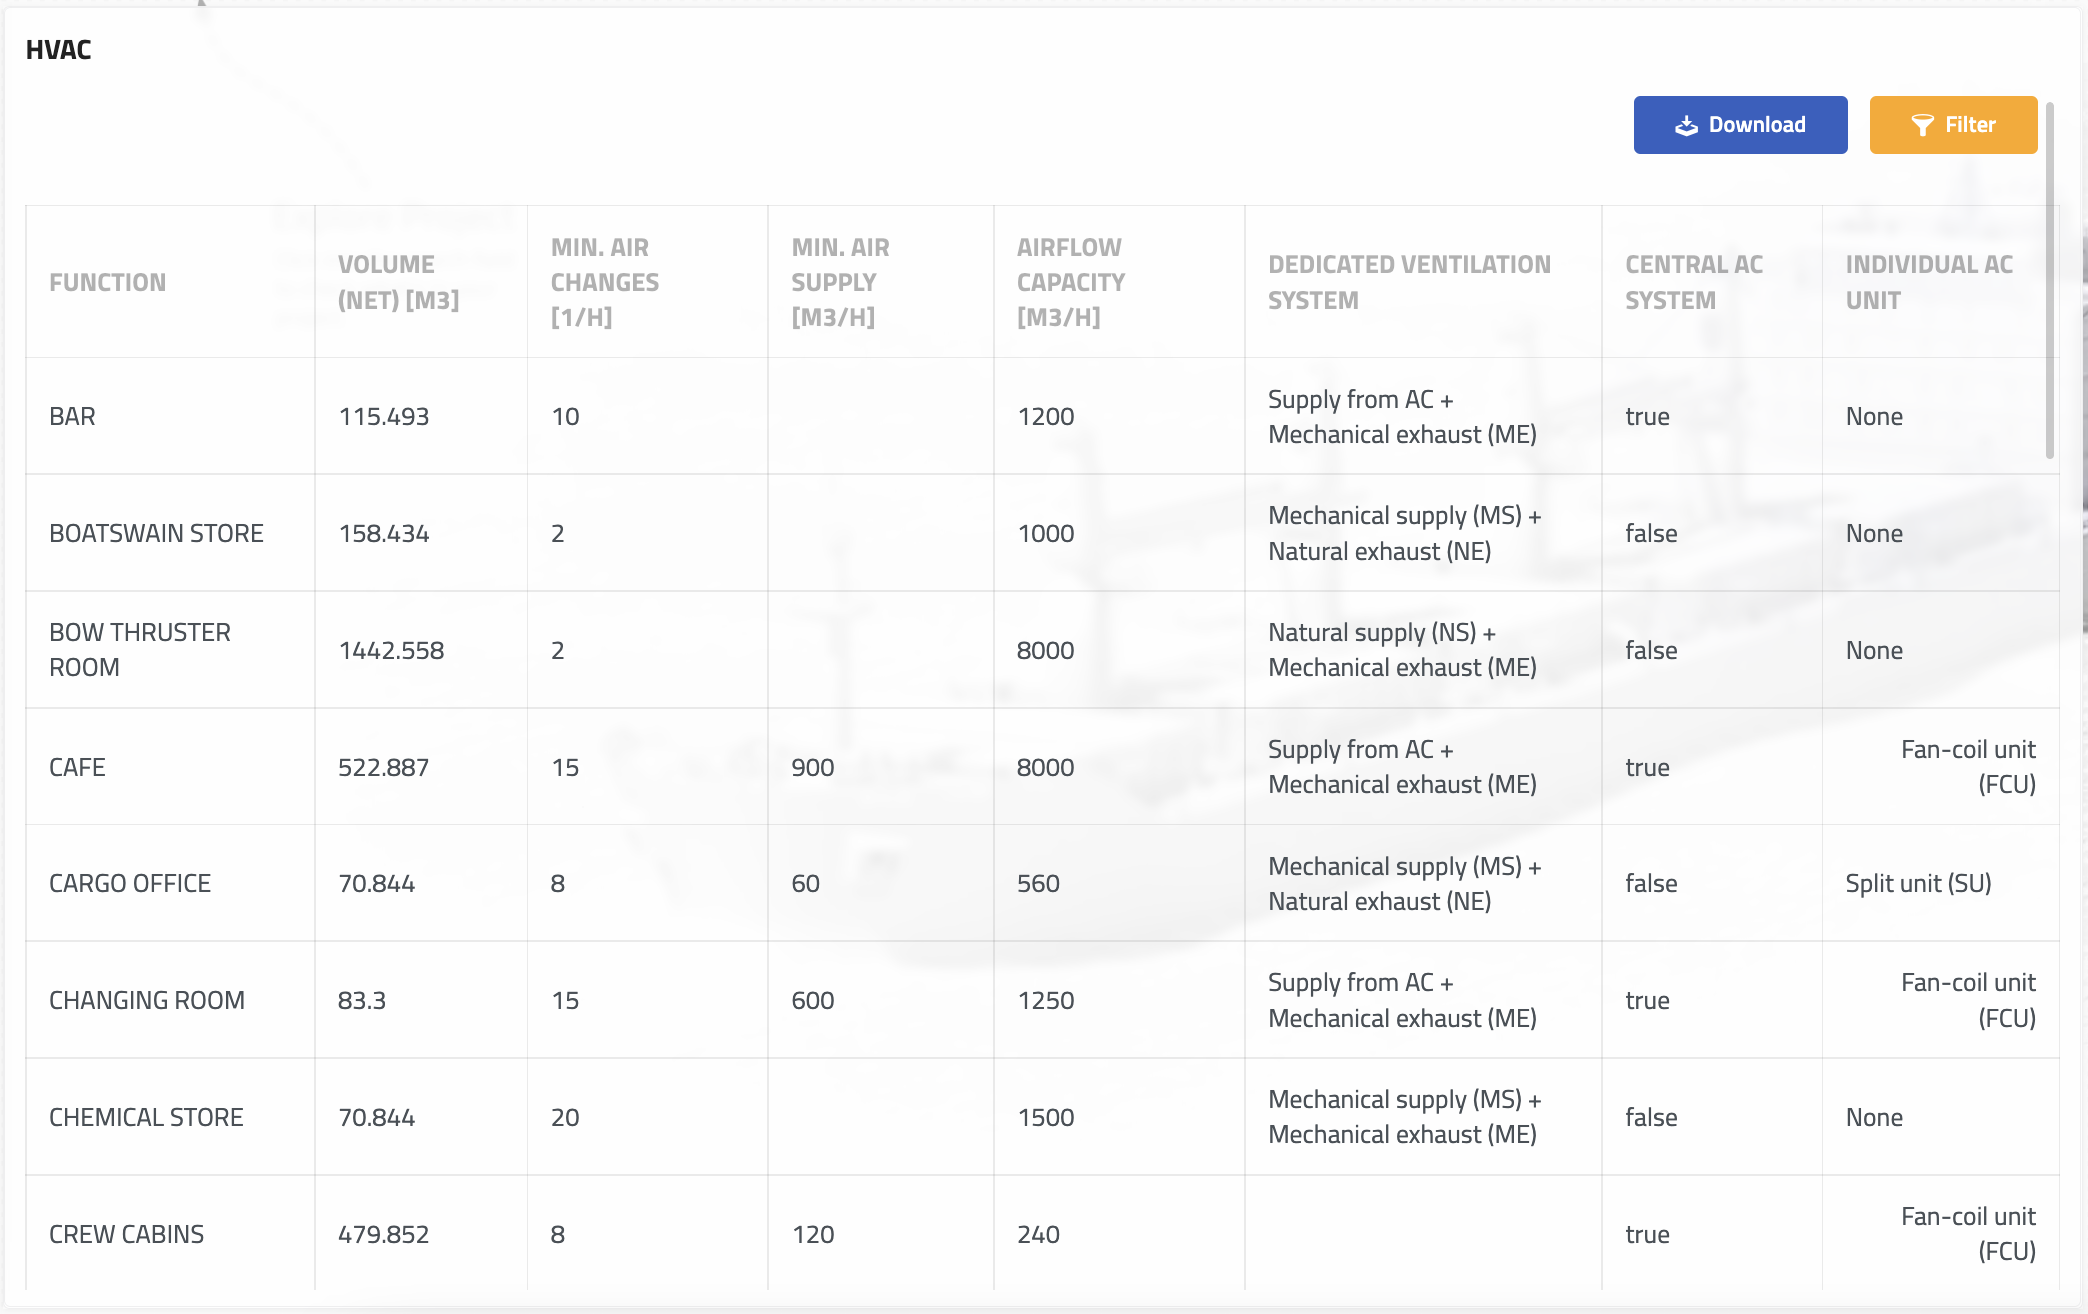
In order to efficiently fill in the data based on certain conditions, such as those mentioned above, we can group the Rooms according to selected properties. In our example, we use two properties ‘Central AC System’ and ‘Individual AC Unit’. This will divide our compartments into several groups according to 3 rules:
- ‘is there a cental AC?’
- ‘is there an individual AC?’
- ‘is there no AC at all?’
In reality, there could be more conditions to distinguish the Rooms into more groups. In our simple case, we apply thermal insulation as follows:
- 80 mm on the walls and 60 mm on the floor for rooms ‘with central AC’
- 60 mm on the walls and 40 mm on the floor for rooms ‘with individual AC’
- no insulation for rooms ‘without AC’
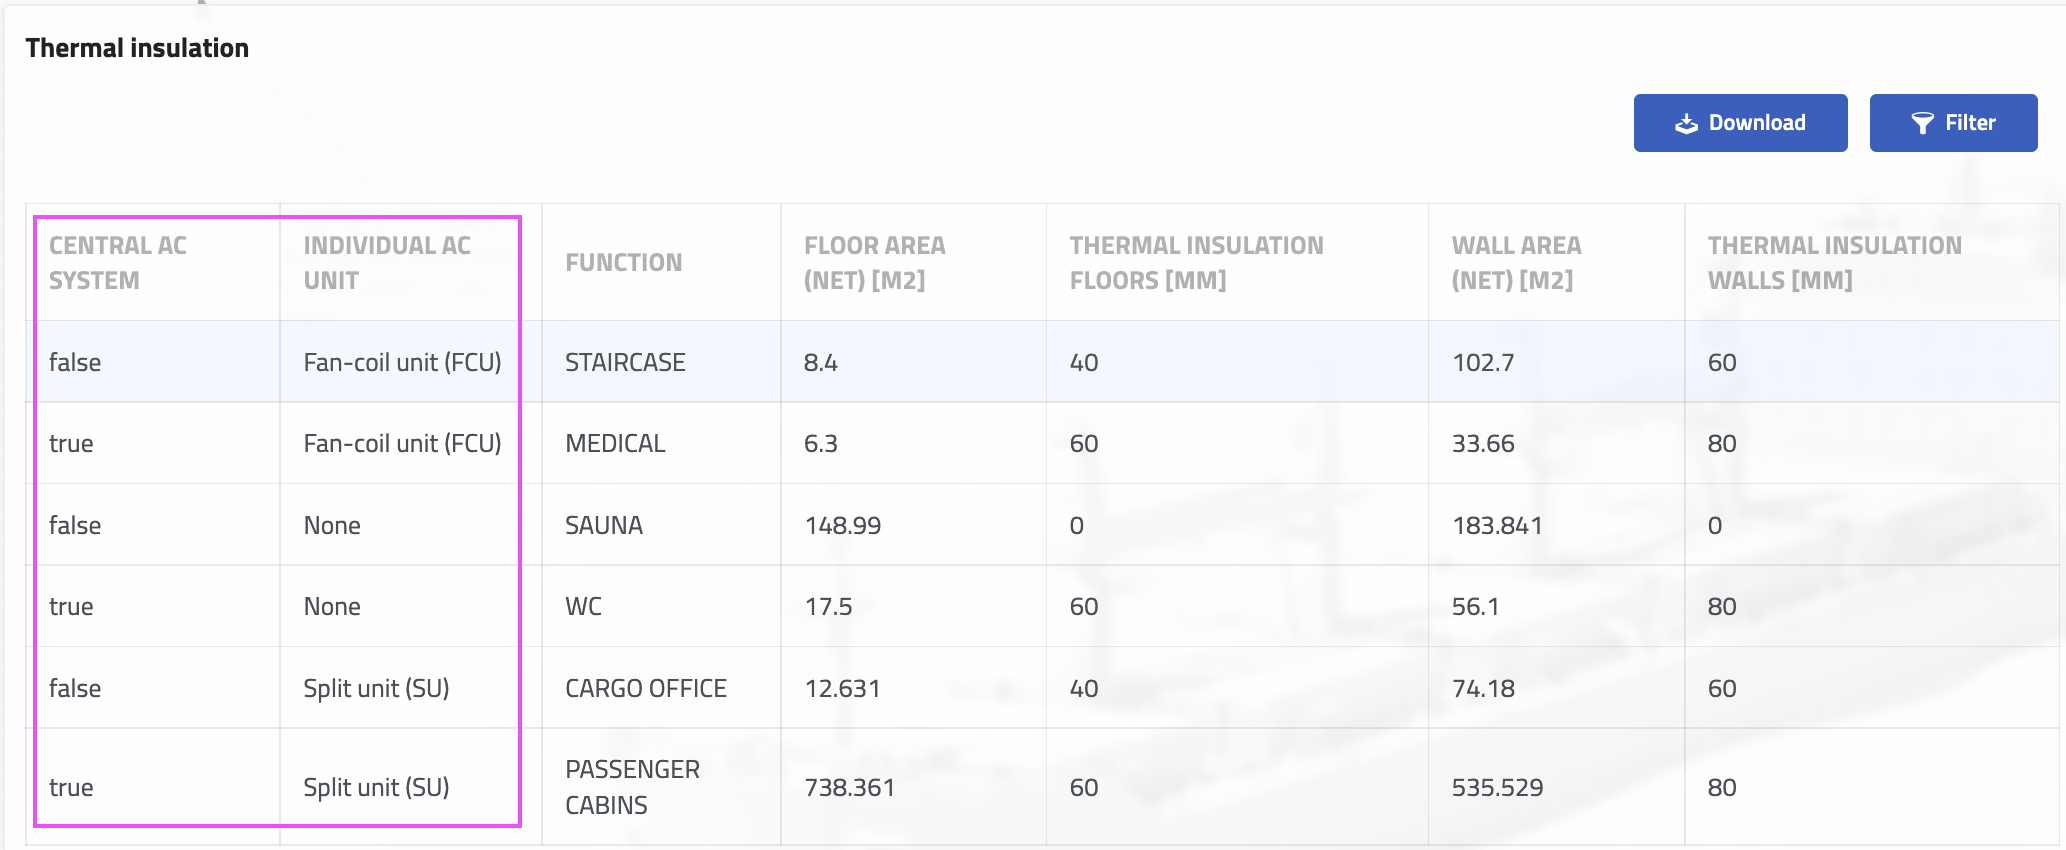
Each of the rooms has received a set of information about the thickness of the applied thermal insulation. Now we can remove the AC-related columns as we do not need them in the Insulation report:
Calculation of insulation by thickness – ‘Filter’ function and Sum column function
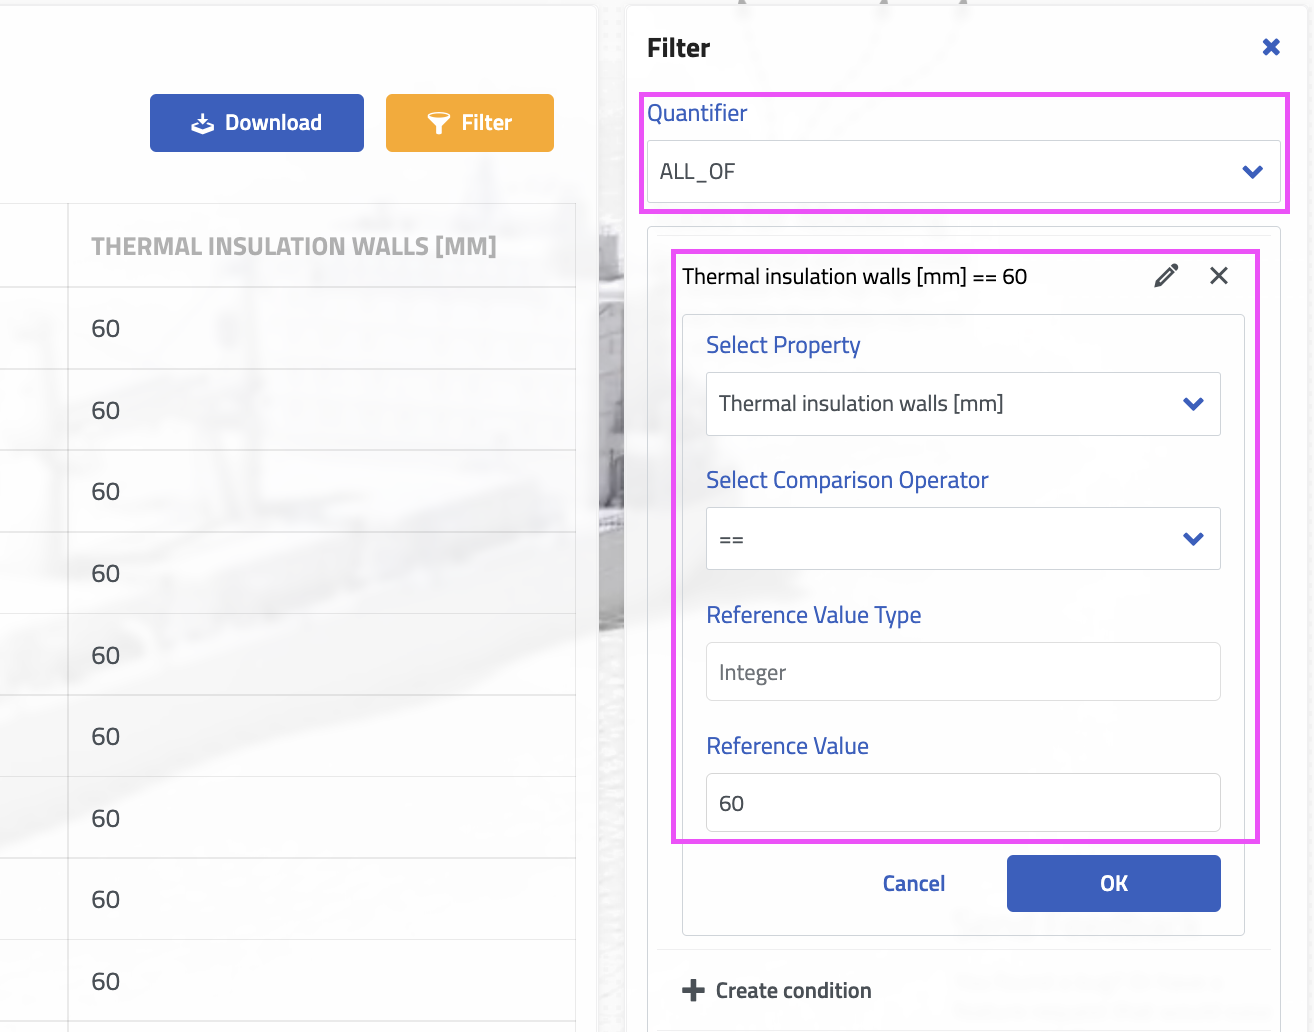
Now it’s time to calculate how much insulation we actually need. To list the total area of insulation (area of walls or floors) with a given thickness, we use the filter function in combination with the summation of the columns.
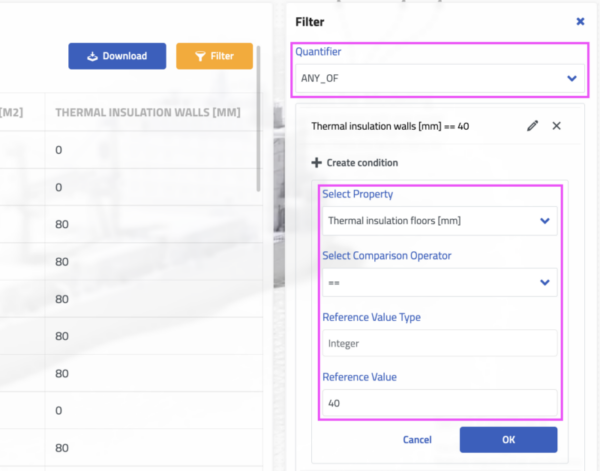
First, to display only records with a specific insulation thickness, we apply a filter. If we are interested in 60 mm thick insulation, we apply the following condition: Thelmal insulation of floors/walls should be of 60 mm and we use the default ALL_OF quantifuer. The quantifier decides if:
- all of the listed conditions (ALL_OF), or
- one of listed conditions (ANY_OF), or
- none of (NONE_OF) the listed conditions must be satisfied to display a praticular row of data.
In our case, ALL_OF is perfectly fine.
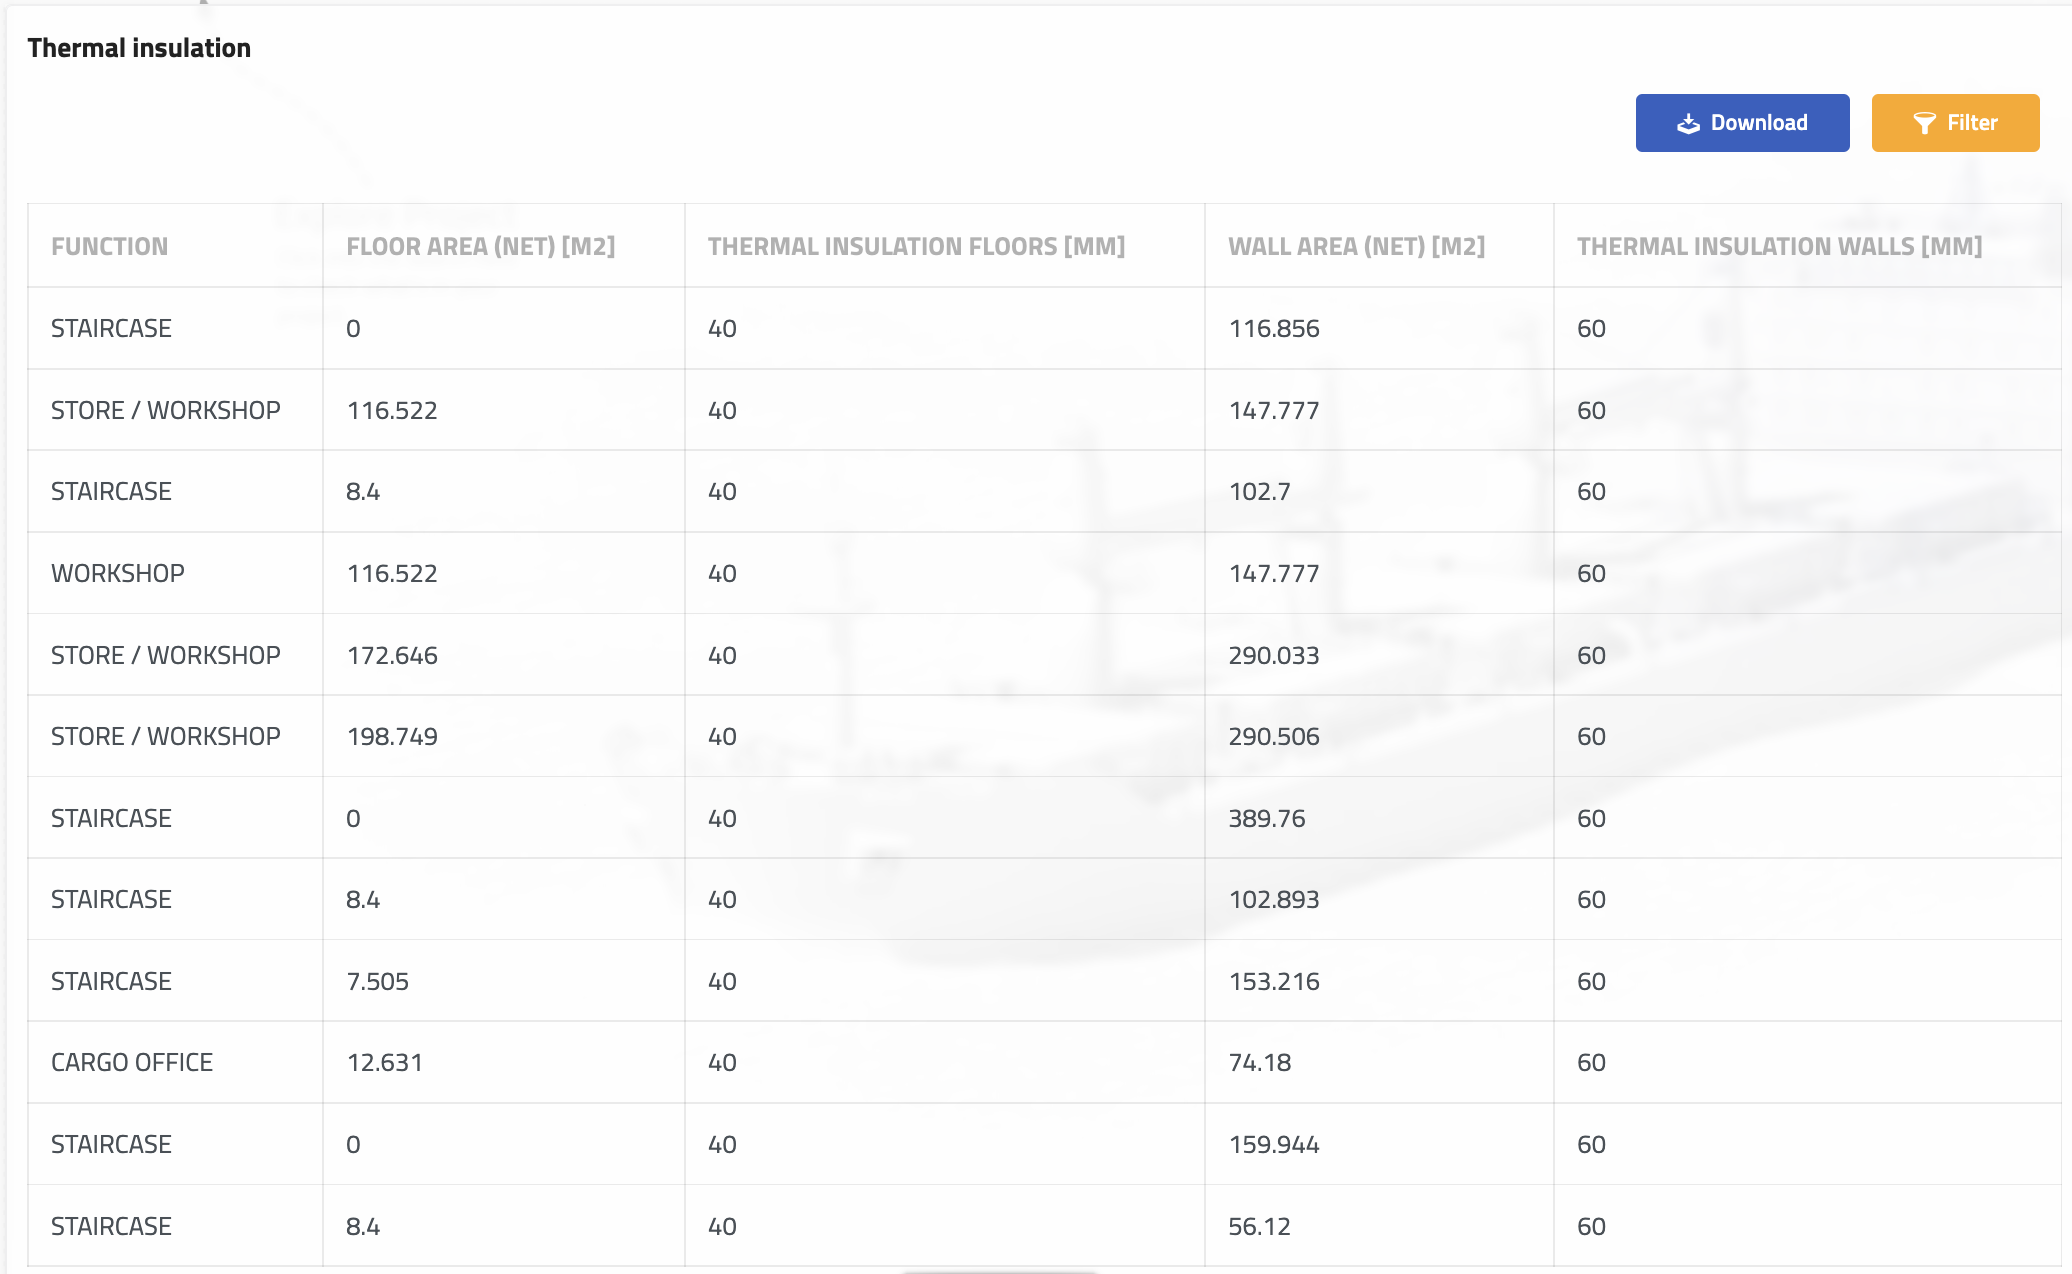
The result is that the report lists all compartments whose walls are insulated with 60 mm of thermal insulation:
Then we edit the column to show a sum of the wall areas:
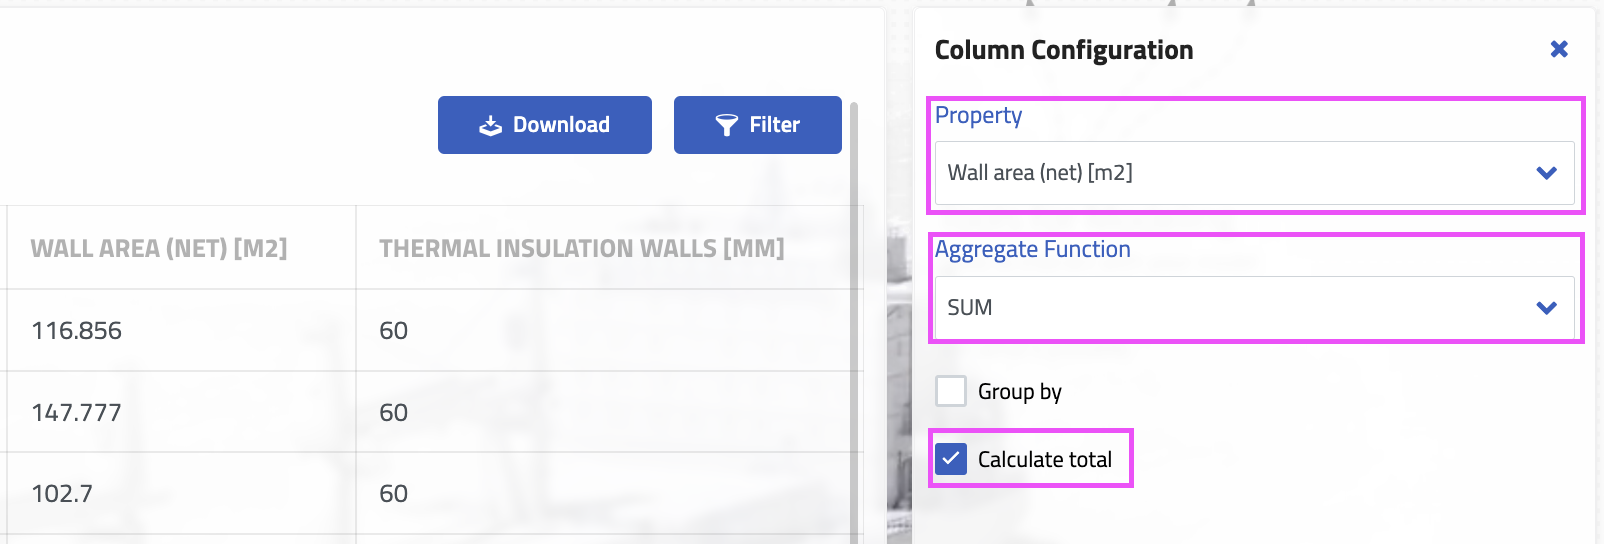
As a result, the report displays the total area of the walls insulated with 60 mm of insulation:
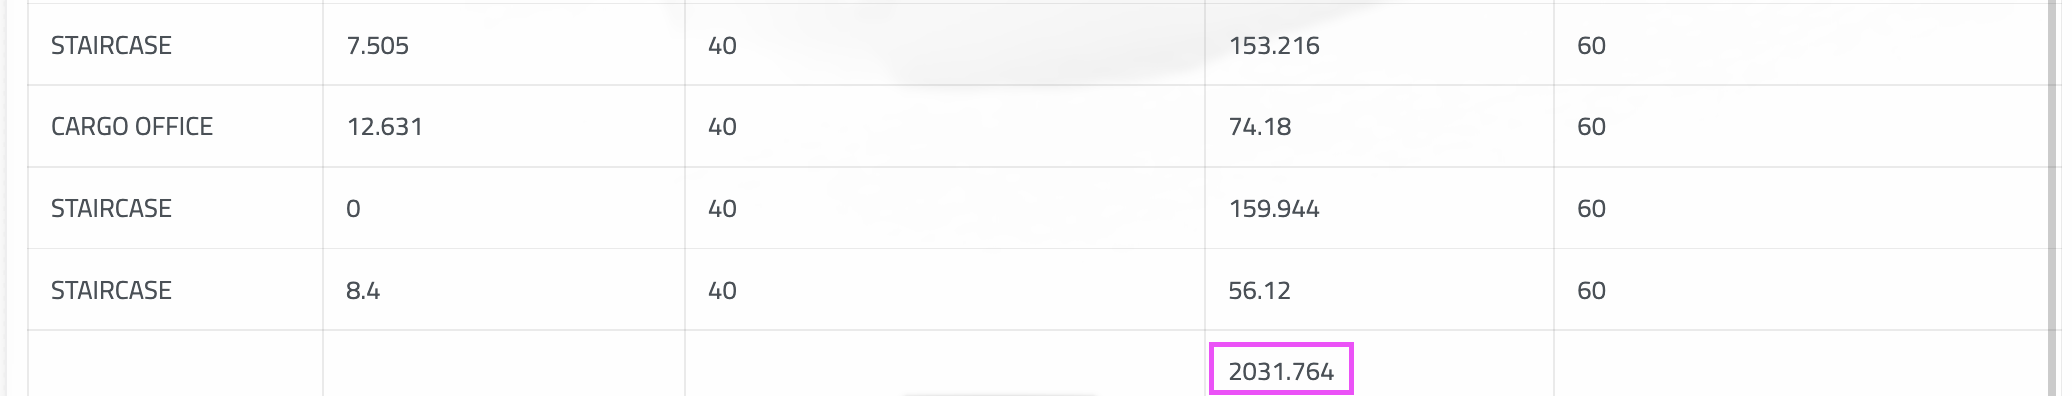
Results of the calculation
In our case, the total area of 60 mm insulation on the walls is 2032 m2, which weighs about 6 tons for standard thermal insulation. If we repeat the ‘filter -> sum’ procedure for the floors, we get 4044 m2, which weighs 11.8 tons. Therefore we can calculate all the amount insulation in the project easily.
Summary
The reporting function allows to retrieve most of the 5D model database. It facilitates both writing data to the model and extracting accurate information of interest. The reports can be downloaded in Excel format so that the data can be integrated into other platforms. The minimal effort required to create an interactive 3D model in Naval Architect provides design teams with a unique opportunity to obtain valuable information for reliable cost and weight calculations at a very early stage of ship design.
TRY US!
Try our Sandbox Version and all its features for free: Register now
See you on the Sandbox!
Related Posts